Citi's $2,100 Sandisk call leans on Micron; Sandisk's own guide leans the other way
Citi kept its $2,100 buy on Sandisk the day after Micron's NAND revenue jumped 42% sequentially. The 29 October report tests that extrapolation: guidance cuts growth to a third of last quarter's pace, and $2.8 billion of the July quarter's $7.1 billion of operating cash flow was customer deposits and unpaid taxes.
 Vincent Jiang · 3 min read
The buy was refreshed by Micron's quarter
Citi kept its buy rating and $2,100 target on Sandisk on 1 October, one day after Micron printed a record $14.1 billion NAND quarter 12. The case: Micron's NAND revenue rose 42% sequentially on bits up about 10% and prices up almost 30%, beating Citi's own 20% price assumption, with supply tight through 2028 and analyst Atif Malik pointing to data centers offloading AI key-value cache work onto cheaper SSDs 1.
The rating predates the print; Citi reiterated the same $2,100 on 9 September 3. Sandisk closed at $1,728 on 1 October 1 and reports fiscal Q1 on 29 October 4.
The margin is the market's, not the company's
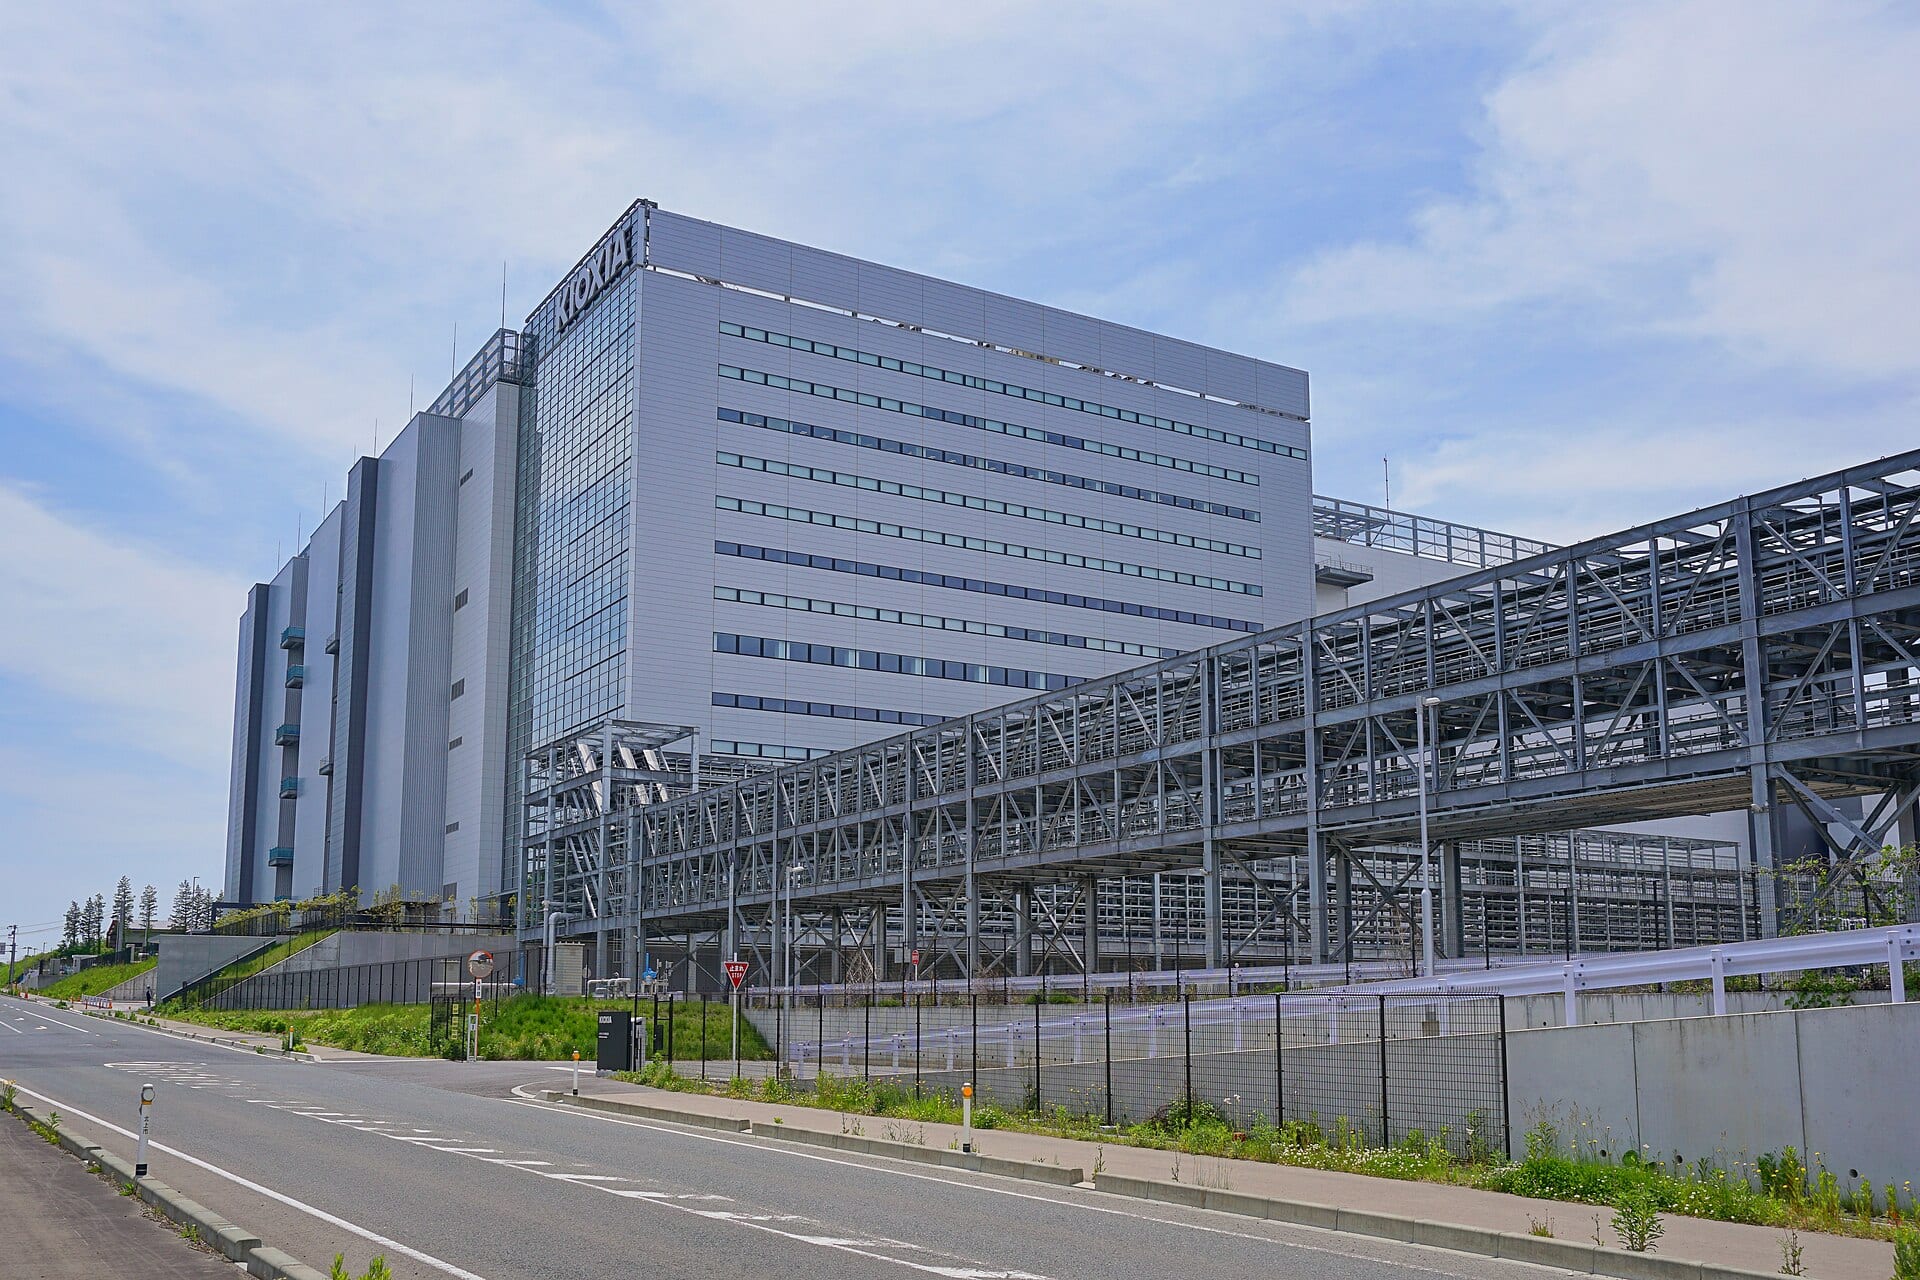
Sandisk buys every wafer from its Flash Ventures joint venture with Kioxia at cost plus a small markup 5, so contract prices land almost whole in gross margin. Last quarter that mechanism delivered $8.965 billion of revenue, up 51% sequentially at an 84.6% margin, two-thirds of the growth from price 6. An 84.6% gross margin on cost-plus wafers is a reading of NAND prices, not of Sandisk.
The Q1 guide of $10.3–10.8 billion implies 17.7% sequential growth, a third of the pace 46. TrendForce has contract prices rising 10–15% this quarter after 70–75% 7; Micron guided its own December quarter up 13% after total revenue printed up 31% 2; and Consumer revenue, the part where buyers can walk, fell 32% last quarter 6.
From $1.9 billion to $8.97 billion in six quarters; the guided next step is 18%, not 51%
- Revenue
- Estimate
Data
| Revenue | |
|---|---|
| FQ3 '25 | $1.7B |
| FQ4 '25 | $1.9B |
| FQ1 '26 | $2.31B |
| FQ2 '26 | $3.03B |
| FQ3 '26 | $5.95B |
| FQ4 '26 | $8.97B |
| FQ1 '27 guide (estimate) | $10.55B ($10.3–10.8B) |
Two-fifths of the cash was other people's money
Fourth-quarter operating cash flow was $7.126 billion 6. Inside it sat $2.091 billion of customer advances and refundable security deposits booked under the New Business Model agreements, plus $730 million of income taxes not yet paid 6; neither repeats. Sandisk itself strips out a $1.938 billion NBM prepayment-and-deposit impact and calls the quarter's adjusted free cash flow $5.035 billion 6.
$2.8 billion of the quarter's $7.1 billion of operating cash was deposits and unpaid taxes
Data
| Part | FQ4 2026 operating cash flow | Share |
|---|---|---|
| Customer advances and refundable deposits | $2.09B | 29.3% |
| Income taxes accrued, unpaid | $0.73B | 10.2% |
| All other operating cash | $4.31B | 60.5% |
Income taxes payable of $1.286 billion remain on the balance sheet 6, and the buyback the board just raised to $15.5 billion, after $4.524 billion of Q4 repurchases, is funded from operating cash 56.
Who pays if the guide is the ceiling
Analyst averages sit above the company's own ceiling: $46.11 of expected EPS against a $44–46 guide, on $10.633 billion of expected revenue 4. If the guide holds, the surplus routes to the buyback and to the NBM customers holding $59.8 billion of committed volume, about 19% of it deliverable within 12 months 56.
If it does not, the loss lands on holders already about 27% below June's $2,354.39 high 17, with $121.4 million of insider selling over three months on the tape 910. Whether that selling is doubt or diversification, no filing says. Two lines settle the argument on 29 October: revenue against the $10.8 billion top, and gross margin against 84.6%.
Deepdive
AI-generated from this story and its cited sources. Not investment advice.