Uber's 53% Price Climb Built Its Profits. AI Agents May Claw Them Back
Columbia's Len Sherman measured 37,500 Uber trips: waits up 19%, prices per mile up 53% since Q1 2023. Uber disputes the numbers but will not answer them, and AI shopping agents are arriving to check.
 Vincent Jiang · 3 min read
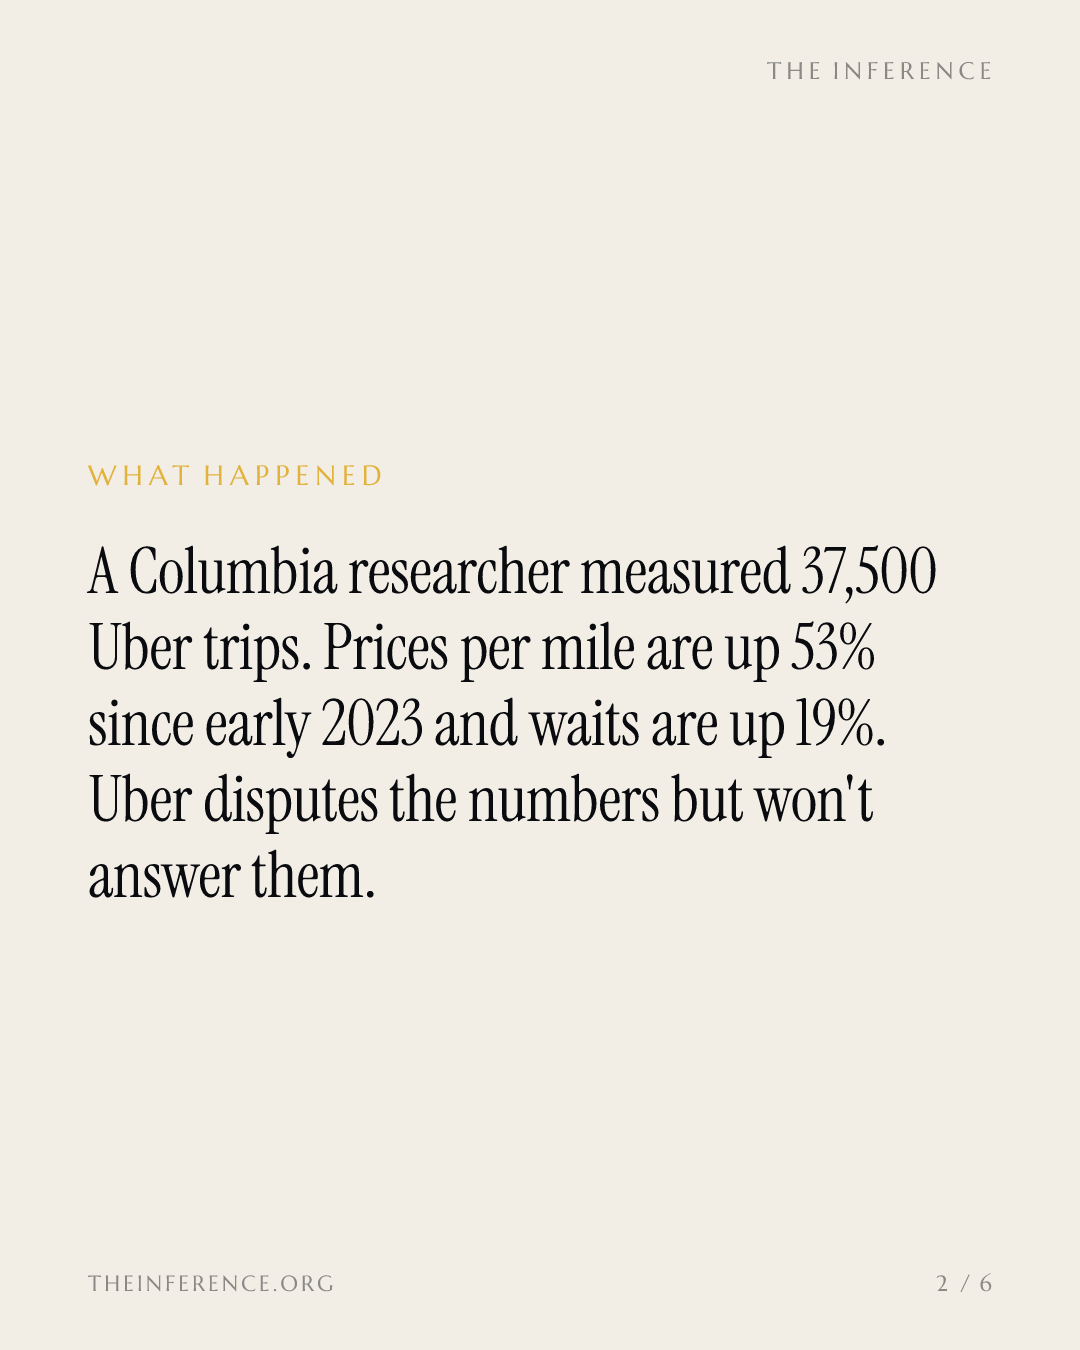
The number that should worry Uber's shareholders is not the wait. It is 53%. Len Sherman, executive in residence at Columbia Business School, examined 37,500 driver-completed trips across six US cities and found the average price per mile Uber charged rose 53% between Q1 2023 and Q1 2026, while the time from match to arrival grew 19% 1. "You're charging more for less, for degrading the service," he told Business Insider 1.
Waits rose in five of the six cities, and Sherman counts his own figure an underestimate, since driver-side data miss the minutes Uber spends shopping each ride to drivers before a match 1. Business Insider is the only outlet carrying the 19% and 53% figures, and no independent audit has checked either.
The spread is the profit engine
The filings show what that spread bought. Consolidated operating income climbed from $394 million in Q3 2023 to $1.89 billion in Q2 2026, a nearly fivefold rise 2. The platform behind it counts 208 million monthly active consumers and $223 billion in annualized run-rate gross bookings 5.
Uber's quarterly operating income nearly quintupled from Q3 2023 to Q2 2026
Data
| Operating income | |
|---|---|
| Q3 '23 | $0.39B |
| Q4 '23 | $0.65B |
| Q1 '24 | $0.17B |
| Q2 '24 | $0.8B |
| Q3 '24 | $1.06B |
| Q4 '24 | $0.77B |
| Q1 '25 | $1.23B |
| Q2 '25 | $1.45B |
| Q3 '25 | $1.11B |
| Q4 '25 | $1.77B |
| Q1 '26 | $1.92B |
| Q2 '26 | $1.89B |
Sherman's June study, built from nine years of three drivers' records, put Uber's take of each fare above 50% in some cities, against 15% to 20% a decade ago, with rider fares and driver pay scissoring apart after upfront pricing arrived in 2022 3. "This is still the profit engine for Uber," he said 3. A Consumer Reports analysis by Princeton's Workers Algorithm Observatory, covering Oregon, calculated take rates of 44% for Uber and 52% for Lyft 4.
Uber's answer is a different number, not an audit
A spokesperson said the analysis "relies on a number of inaccuracies, which we've publicly refuted," and declined to address either headline figure 1. Uber's January blog post put its average take at 21% of fares in Q3 2025 and called it false that profitability came from raising prices for a bigger share 3. Between 21% and 50% sits the whole margin question.
Uber claims a 21% take; outside studies measure 44% and up
- Estimate
Data
| Value | |
|---|---|
| Uber's claimed average, Q3 '25 | 21% |
| Consumer Reports: Uber, Oregon | 44% |
| Sherman: some cities (estimate) | 50% |
| Consumer Reports: Lyft, Oregon | 52% |
The trip data came from GigU, a driver app that scans more than 15 million ride offers a day and shows pay per mile before a driver accepts 61. Riders do their own version of the math: one Hacker News commenter reported no sub-$60 airport run in years 7.
Agents close the gap Sherman measured
Sherman's named threat is not the regulator but the agent: AI shoppers that compare Uber against Lyft or local rivals in seconds, eroding the price opacity a high take rate needs 1. Reputation is already sliding, with the Axios Harris Poll 100 ranking Uber 72nd this year, down from 58th in 2025 1. The Inference traced this same squeeze through app-store cuts and checkout on 30 September; ride-hailing was always next in line.
If Uber's 21% is the true number, the price rises are efficiency and likely durable. If Sherman's 50% is, every agent comparison is an arbitrage ticket. The two tells: Uber's next pricing commentary, and the first hard count of agent-routed bookings.
Deepdive
AI-generated from this story and its cited sources. Not investment advice.