Paycom beat every line, then spent $1.39 billion on buybacks while carrying $750 million of debt
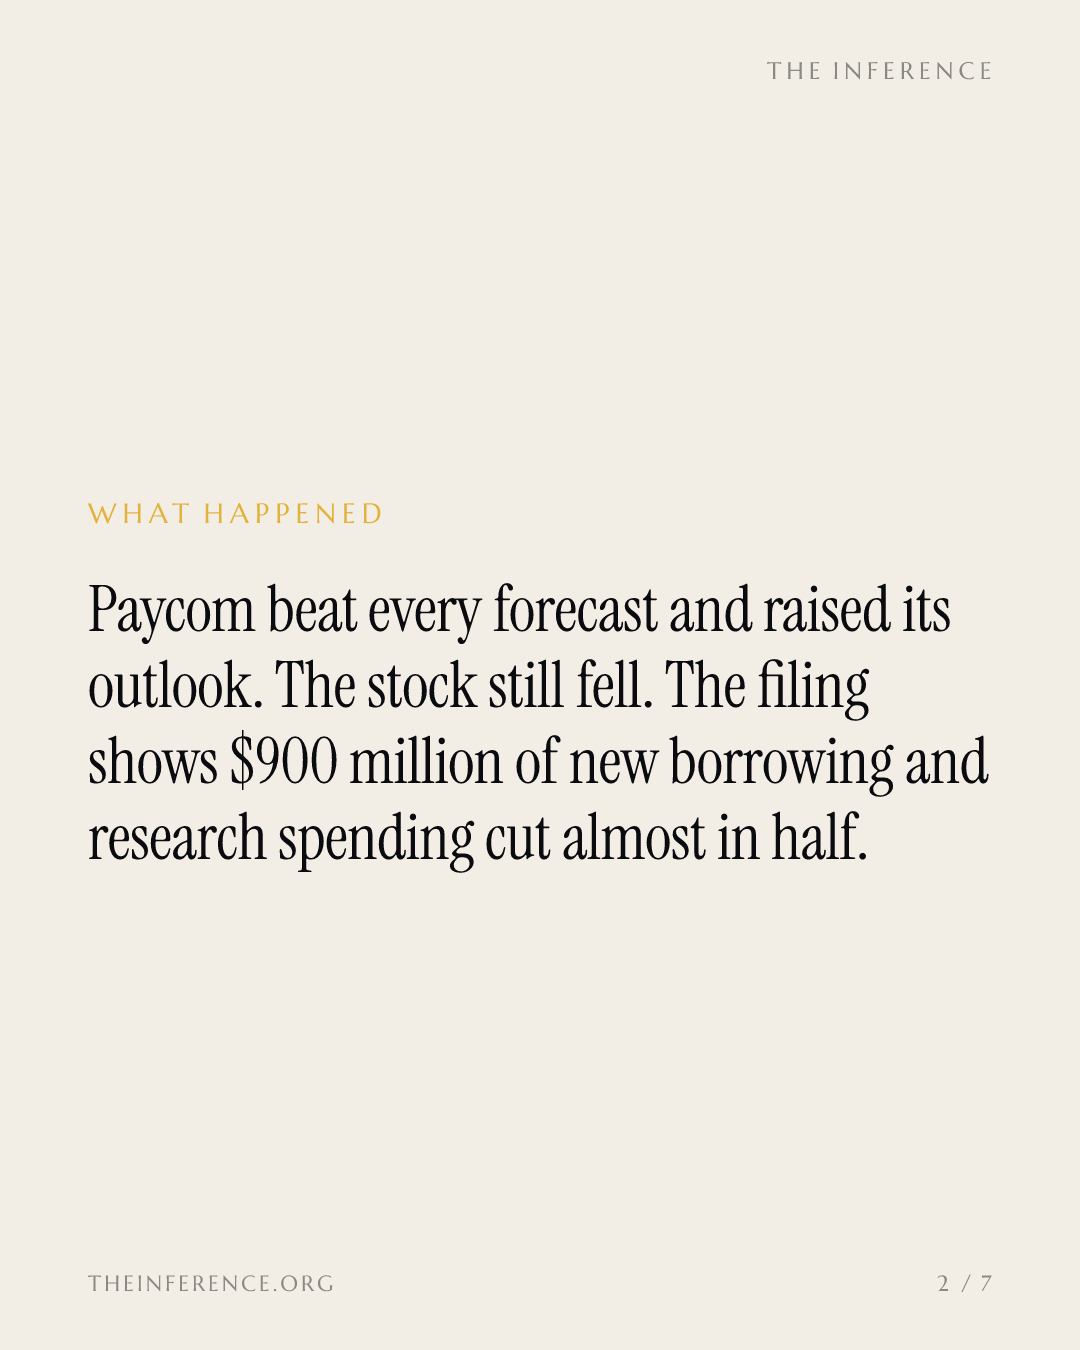
Paycom beat every line and raised its 2026 outlook, but the filing shows a debt-free balance sheet became a $750 million leveraged one in nine months, funding buybacks that shrank the share count by 19% while R&D was halved.
 Vincent Jiang · 3 min read

Paycom beat everything, and the stock fell anyway
Paycom−6.76% — Paycom, down 6.76 percent today Software, the Oklahoma City payroll and HR software company founded by Chad Richison, reported third-quarter results on Wednesday November 4, 2026, that cleared every bar: revenue up 10.2% to $543.8 million, adjusted EPS of $3.37 about 20% above the $2.80 analysts expected, adjusted EBITDA of $268.1 million against a consensus of $235.7 million, and a raised full-year outlook 13.
Richison credited the "tremendous ROI" clients get from the platform's automated decisioning and said the company was "once again raising our full-year outlook" 1. Shares still fell 4.8% to $254.90 after the release 3. The reason was not the income statement. It was two pages further in.
The debt did not exist a year ago
The release shows Paycom drew $900.0 million on its credit facility this year, spent $1,390.9 million buying back stock in nine months against $218.9 million a year earlier, and carried long-term debt of $750.0 million at September 30, against none at the end of 2025 1. Shares outstanding dropped from 54.8 million in December to 44.3 million by September 30, about 19%, and diluted shares in the quarter fell to 44.5 million from 56.4 million 12.
Cash fell to $193.9 million from $370.0 million; stockholders' equity shrank to $707.3 million from $1,731.5 million 1. Operating income rose 74%, but most of the jump in earnings per share is arithmetic on a shrinking denominator, not growth in the business 1.
The margin was partly manufactured
The 49.3% adjusted EBITDA margin, up from 39.4% a year earlier, was fed from the cost side too: research and development expense was cut to $38.5 million from $74.1 million, capitalized development costs to $17.4 million from $43.5 million, and stock-based pay to $20.3 million from $31.1 million 1. Paycom's own filing history shows the squeeze started earlier: R&D expense fell 30.6% year on year in the second quarter of 2026, after years of double-digit increases 5.
Paycom cut R&D expense by nearly half in five quarters
R&D nearly halved in five quarters as the margin climbed
Data
| R&D expense | |
|---|---|
| Q3 '24 | 63 |
| Q4 '24 | 66.7 |
| Q1 '25 | 62.3 |
| Q2 '25 | 74.8 |
| Q3 '25 | 74.1 |
| Q4 '25 | 72.2 |
| Q1 '26 | 60.7 |
| Q2 '26 | 51.9 |
| Q3 '26 | 38.5 |
The buybacks ran ahead of the cash
Free cash flow for the nine months rose to $536.5 million from $285.4 million, a genuinely strong number 1. It is also less than half the $1,390.9 million of stock repurchased 1, and the gap tracks the $900.0 million drawn on the credit facility 1. On November 5 the company added a first cash dividend of $0.375 per share, its first ever 4, on top of the buyback and the $750 million of debt 1.
Buybacks ran at more than double free cash flow this year
- Stock repurchased
- Free cash flow
Data
| Stock repurchased | Free cash flow | |
|---|---|---|
| 9M 2025 | $218.9M | $285.4M |
| 9M 2026 | $1,390.9M | $536.5M |
The bull case, stated fairly
The other side has real evidence. Recurring revenue is 95.5% of sales, the customer acquisition payback period is 12 months, billings grew 10.1% to $544.7 million, and full-year EBITDA guidance of about $1.07 billion sits well above consensus 123.
Richison's pitch is that a mature, seat-priced payroll business should return cash, and Dealroom notes the raise ranks near the 90th percentile of post-IPO software debt deals 2. Fair. But guidance implies about 8% growth for 2026, down from 17.2% compounded annually over the past five years, and sell-side analysts project 6.3% over the next twelve months 13.
The market has already priced this trade-off once this week: HubSpot−6.76% — HubSpot, down 6.76 percent today, the marketing-software company, beat on EPS and widened its margin and still fell 4.2% to $207.05 when its next-quarter revenue guidance came in below consensus 6.
The lever has less room to run
Earnings per share is growing faster than the business underneath it, and $750 million of debt now sits under a company guiding to 8% revenue growth 1. Watch the 2027 guidance in the fourth-quarter release and the dividend's first full quarters: if revenue growth stays near 8% while interest and payouts come due, the share-count lever has less room to run 1.
Revenue growth has hovered in single or low double digits for two years
Growth has run below its five-year 17.2% pace for two years
Data
| Revenue growth, yoy | |
|---|---|
| Q3 '24 | 11.2 |
| Q4 '24 | 13.6 |
| Q1 '25 | 6.1 |
| Q2 '25 | 10.5 |
| Q3 '25 | 9.2 |
| Q4 '25 | 10.2 |
| Q1 '26 | 7.8 |
| Q2 '26 | 9.8 |
Get Applications by email, free
How AI is changing the software people and companies use. In our daily email, every weekday.